New - 2 Hours Ago


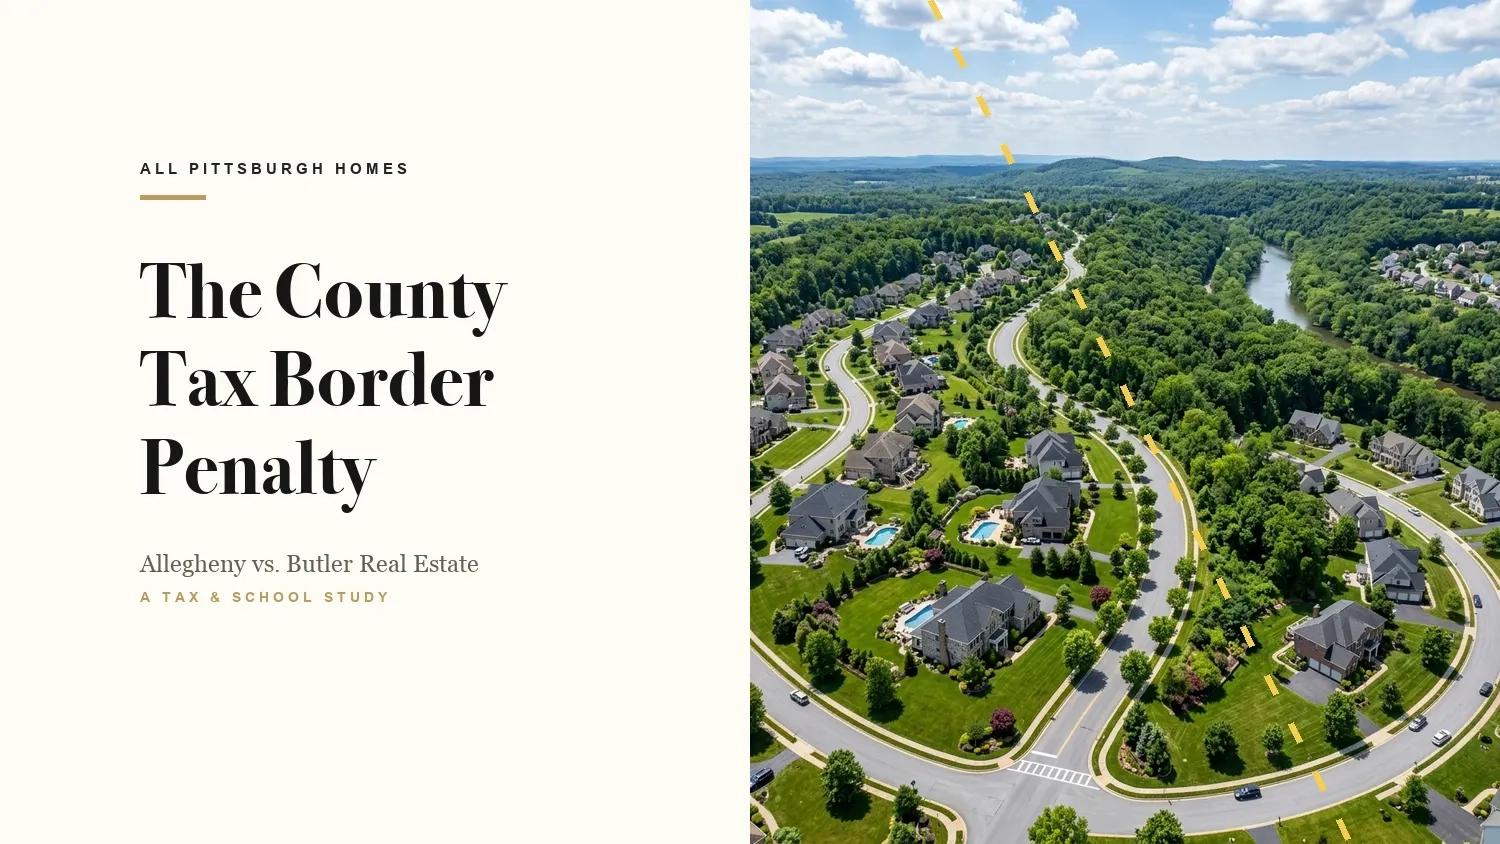
Across the entire Commonwealth of Pennsylvania, few county borders create as dramatic a financial divergence in residential real estate as the boundary separating Allegheny County and Butler County. While the two jurisdictions sit immediately adjacent to each other, crossing this invisible line changes your property tax assessment structure, your monthly mortgage escrow, your school district options, and your overall purchasing power.
For homebuyers evaluating Greater Pittsburgh, two properties priced at the exact same dollar amount produce radically different monthly housing payments depending entirely on which side of the county line they stand. Understanding the tax mathematics, assessment appeal dynamics, and lifestyle realities between Allegheny and Butler counties is essential before writing an offer on a Western Pennsylvania property.
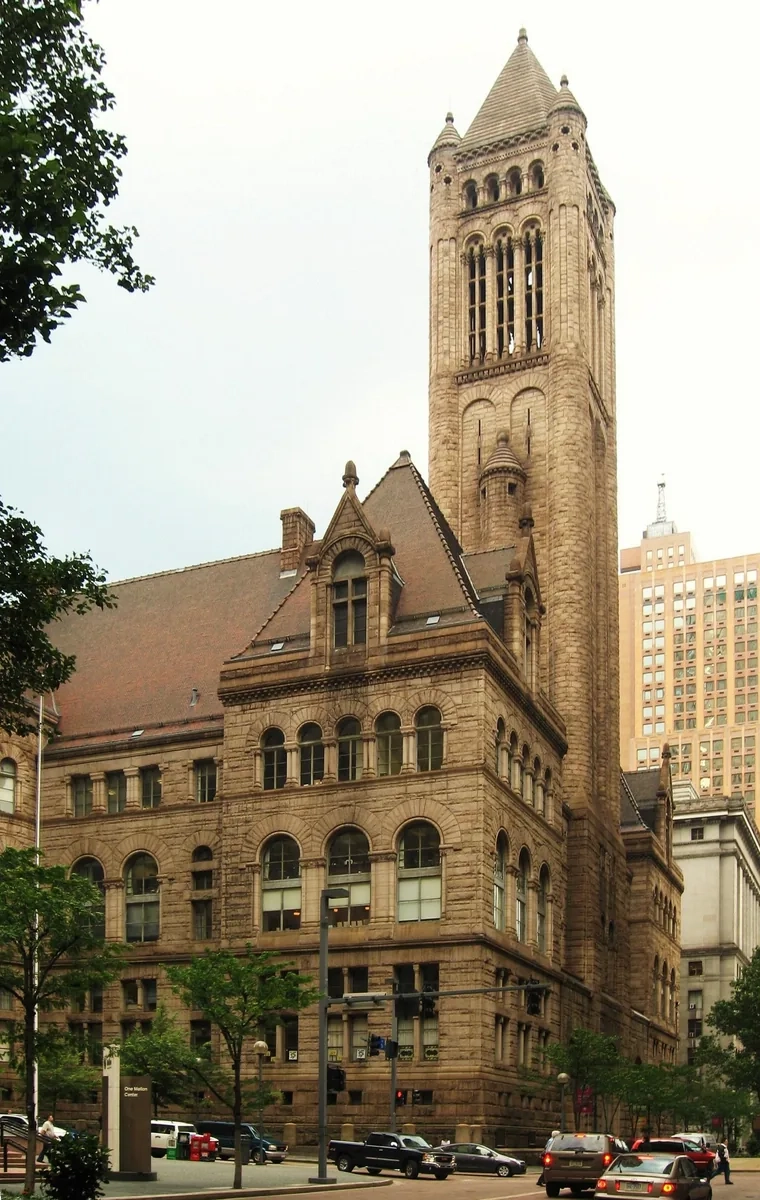
To understand the structural divergence between these two adjacent markets, examine this comprehensive comparative table analyzing taxation mechanisms, median pricing, transit, and development velocity:
| Real Estate Indicator | Allegheny County | Butler County | Structural Distinction |
|---|---|---|---|
| Base County Millage Rate | 4.73 Mills | 27.64 Mills (Different Base Formula) | Allegheny uses 2012 base year; Butler uses lower baseline assessed valuations |
| Effective Property Tax Rate | 2.4% to 3.2% of Market Value | 1.3% to 1.7% of Market Value | Butler County saves 30% to 50% in annual property tax carrying costs |
| County Sales Tax | 7.0% Total (1.0% Local Surcharge) | 6.0% Total (PA State Base Only) | Allegheny levies 1.0% surcharge supporting regional asset district |
| Local Earned Income Tax (EIT) | 1.0% to 3.0% (Suburbs: 1.0%; City: 3.0%) | 1.0% Flat across Most Municipalities | Suburban rates are parity; City of Pittsburgh imposes 3.0% wage tax |
| School Reverse Appeal Risk | High Post-Sale Appeal Frequency | Low to Moderate Appeal Activity | Allegheny districts systematically appeal recent recorded sales |
| Dominant Housing Age | 1920s to 1980s Established Architecture | 1990s to Present Modern Construction | Historic stone and brick vs contemporary master-planned communities |
| Typical Lot Footprint | 0.15 to 0.50 Acres (Suburban Average) | 0.30 to 1.5+ Acres (Subdivision & Acreage) | Butler provides larger usable graded yard parcels |
| Median Single-Family Price | $245,000 (County-wide) / $485,000 (North Hills) | $360,000 (County-wide) / $470,000 (South Butler) | Broad countywide inventory variance across diverse geographic submarkets |
To grasp why property taxes vary so widely across Western Pennsylvania, one must first understand how Pennsylvania calculates real estate tax bills. Property taxes are governed by local millage rates, where one mill equals one dollar of tax for every one thousand dollars of assessed property value. Every property owner receives three separate tax assessments annually:
Comparing raw millage rates directly across county boundaries can mislead uninformed buyers, because Allegheny County and Butler County calculate their underlying assessed values on different base years and formulas. Allegheny County operates on a 2012 base year assessment structure, while Butler County functions on a different historical baseline.
What truly matters to a homeowner is effective taxation: the real dollar amount due at the tax collector office each calendar year. When you calculate actual property tax liabilities on comparable single-family homes, properties in southern Butler County (such as Cranberry Township, Adams Township, Seven Fields, and Mars) consistently carry annual tax bills that are thousands of dollars lower than equivalent properties in northern Allegheny County (such as Wexford, McCandless, Pine, Hampton, and Marshall). For an analysis of municipal boundary nuances, review the comparative guide on Cranberry Township vs Wexford PA.
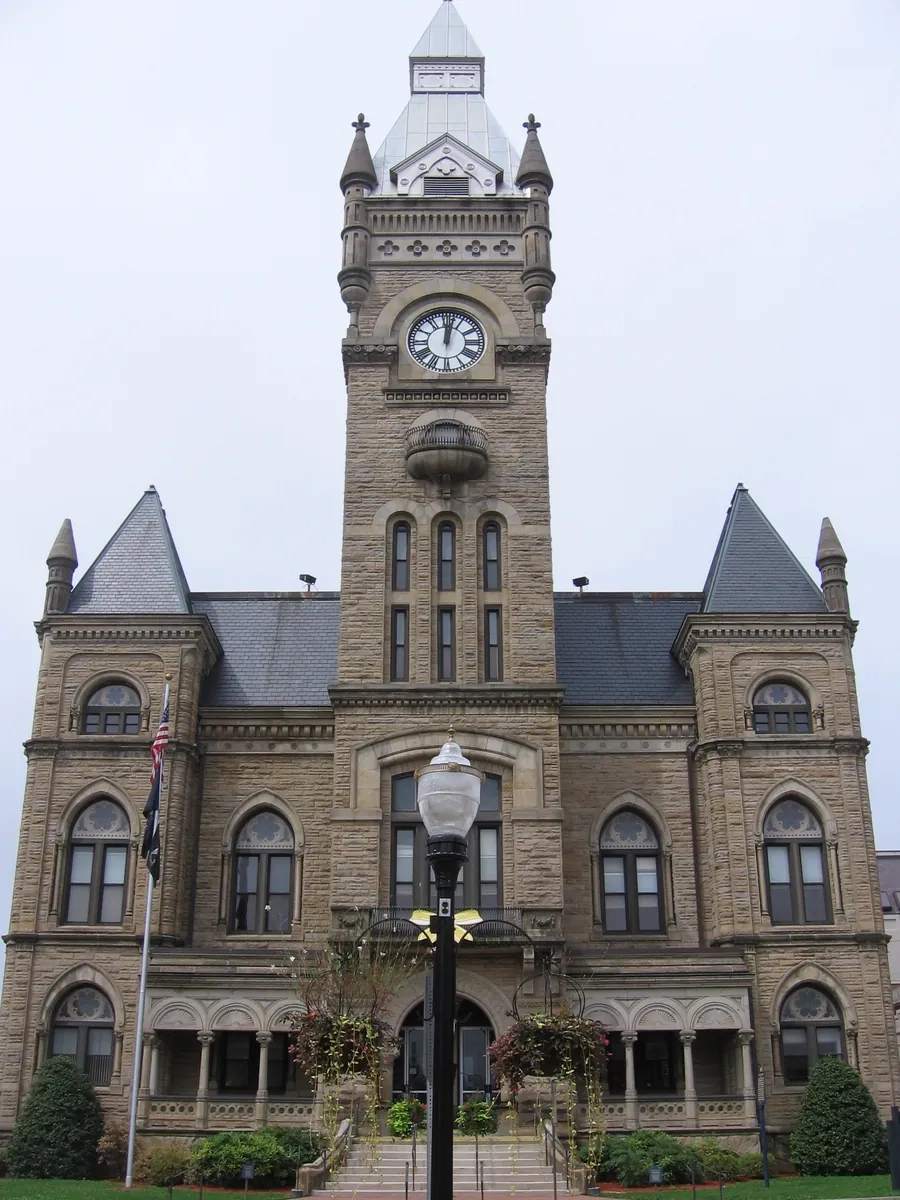
To evaluate the long-term cumulative impact of county differences, consider a comprehensive 10-year total cost of ownership model for a household purchasing a $500,000 home with an annual household income of $120,000:
| Cost Component | Allegheny County Suburb (e.g., McCandless) | Butler County Suburb (e.g., Cranberry) | 10-Year Cumulative Cost Variance |
|---|---|---|---|
| Annual Property Taxes | $12,500 per year | $7,200 per year | $53,000 in Butler County savings |
| Local EIT on $120,000 Income | $1,560 per year (1.3% combined) | $1,200 per year (1.0% flat) | $3,600 in Butler County savings |
| Realty Transfer Tax (Purchase) | $10,000 (2.0% rate) | $10,000 (2.0% rate) | Parity ($0 difference) |
| Sales Tax on $20,000 Goods/Yr | $1,400 per year (7.0% rate) | $1,200 per year (6.0% rate) | $2,000 in Butler County savings |
| Total 10-Year Financial Impact | $154,600 | $96,000 | $58,600 Total Butler Advantage |
As this financial model proves, living on the Butler County side of the boundary line delivers approximately $58,600 in cumulative cash savings over a ten-year residency period. For households seeking to maximize their wealth accumulation and preserve monthly disposable income, this economic arbitrage is a compelling factor.
Beyond baseline millage rates, buyers moving into Allegheny County must understand the local post-closing assessment appeal risk. In Allegheny County, public school districts monitor recorded real estate deeds closely. When a property sells for a price substantially higher than its historical county assessment on record, the local school board frequently files a formal reverse assessment appeal before the Board of Property Assessment Appeals and Review (BPAAR).
During these hearings, the county applies the Pennsylvania State Tax Equalization Board Common Level Ratio (CLR) to determine the property's new taxable assessed value. While recent legal challenges and judicial rulings have adjusted the CLR downward to provide partial relief to recent buyers, the reality remains that an Allegheny County home purchase often triggers a reassessment that increases your property taxes twelve to eighteen months after closing.
Butler County operates with far less aggressive school district reverse appeal litigation. While reassessment appeals exist within Pennsylvania law, school boards in Butler County rarely target standard residential sales with the systematic vigor seen in Allegheny County. This stability offers predictable monthly budgeting for families financing their homes. To research property history and county records effectively, refer to this detailed resource on navigating Western Pennsylvania public assessment records.
Property taxes are not the only tax line item impacting Western Pennsylvania households. Pennsylvania municipalities levy an Earned Income Tax (EIT) on gross wages earned by residents.
Throughout most suburban municipalities across both Allegheny County and Butler County, the local earned income tax rate is standardized at 1.0 percent (with 0.5 percent allocated to the municipality and 0.5 percent directed to the school district). Suburban communities such as Cranberry Township, Seven Fields, Marshall Township, and Pine Township all share this baseline 1.0 percent rate.
However, significant differences emerge if you compare Butler County to the City of Pittsburgh proper within Allegheny County. Residents living inside Pittsburgh municipal city boundaries pay an Earned Income Tax rate of 3.0 percent (comprising a 1.0 percent municipal tax and a 2.0 percent school district tax). For a household earning $150,000 in gross annual income, moving from the City of Pittsburgh to suburban Butler County or suburban Allegheny County immediately saves $3,000 per year in local earned wage taxes alone.
The architectural landscape and physical layout of residential communities differ substantially between the two counties, reflecting their historical development patterns:
| Real Estate Indicator | Allegheny County Dominant Stock | Butler County Dominant Stock |
|---|---|---|
| Dominant Construction Eras | 1920s to 1980s (Historic and Mid-Century) | 1990s to Present (Modern Subdivisions) |
| Architectural Variety | Stone Tudors, Brick Colonials, Victorians, Custom Ranches | Open-Concept Two-Story, Craftsman, Modern Custom |
| Lot Characteristics | Mature trees, rolling topography, 0.15 to 0.50 acres | Graded master subdivisions, usable yards, 0.25 to 1.0 acres |
| Infrastructure Age | Aging municipal pipes, lead supply lines, mandatory dye tests | Modern PVC and PEX plumbing, newer stormwater retention systems |
Because southern Butler County possessed vast tracts of agricultural land along Interstate 79 and Route 228, development over the past thirty years has favored large-scale, master-planned residential communities. Neighborhoods in Cranberry, Adams, and Seven Fields feature wide curvilinear streets, modern underground utilities, community clubhouses, outdoor swimming pools, walking trails, and neighborhood parks.
Builders offer modern open floor plans, primary bedroom suites with walk-in dressing rooms, multi-car garages, and modern energy efficient insulation. If your preference leans toward newer construction, transitional designs, and vibrant subdivision social scenes, Butler County holds a clear advantage. Review the relocation guide on moving to Cranberry Township PA and view active Cranberry Township properties.
Allegheny County offers a rich collection of established architectural styles. Suburbs such as Mt. Lebanon, Upper St. Clair, Fox Chapel, Sewickley, and Hampton developed across multiple eras spanning the early twentieth century through the 1980s. Here, you discover stone Tudors, brick center-hall Colonials, custom mid-century ranches, and expansive acreage estates shielded by mature hardwood forests.
Many Allegheny County municipalities boast established town centers with walkable commercial streets, local libraries, independent cafes, and passenger light rail transit. While new construction single-family subdivisions exist in northern Allegheny County enclaves like Marshall and Pine, they generally command premium price points due to the scarcity of shovel-ready land. Explore the collection of Wexford PA homes to evaluate northern Allegheny inventory.
Both counties are home to some of the highest-achieving public school systems in the state, making public education a central pillar of real estate value across the region.
Allegheny County contains several premier public school powerhouses, including North Allegheny School District, Upper St. Clair School District, Mt. Lebanon School District, Fox Chapel Area School District, Pine-Richland School District, and Quaker Valley School District. These districts have established decades of academic excellence, distinguished state testing performance, and extensive AP and International Baccalaureate programs.
Butler County is anchored in its southern residential sector by the Seneca Valley School District (serving Cranberry, Jackson, Harmony, and Zelienople) and the Mars Area School District (serving Mars, Adams, and Valencia). Seneca Valley operates a modern secondary campus that rivals small collegiate institutions in scale, offering advanced STEM curricula, specialized vocational technical training, and state-of-the-art fine arts facilities. For a comprehensive ranking of regional public education, consult the comprehensive master guide to the best school districts in Greater Pittsburgh.
Your daily commute into major Pittsburgh employment centers, such as Downtown Pittsburgh, the Strip District, Bakery Square, or Oakland, represents a major lifestyle trade-off when evaluating the two counties.
Allegheny County suburbs enjoy closer proximity to the urban core. From northern Allegheny communities like Ross, McCandless, and Hampton, commute times into Downtown Pittsburgh typically range from twenty to thirty minutes via Interstate 279 (the Parkway North) or Route 28. Furthermore, I-279 features dedicated High Occupancy Vehicle (HOV) lanes that allow carpoolers and transit riders to bypass morning congestion entirely.
Butler County commuters face greater distance and regional traffic bottlenecks. Commuters traveling south from Cranberry or Adams must navigate the Interstate 79 and Route 228 interchanges before reaching the Allegheny County border. Morning drive times from southern Butler County into Downtown Pittsburgh average thirty-five to fifty minutes, with adverse weather extending travel times past an hour. However, for professionals working locally at Cranberry Woods, Westinghouse, Thorn Hill Industrial Park, or remotely from home, the geographic distance from Downtown Pittsburgh presents little friction.
When evaluating the choice between Allegheny County and Butler County, prospective purchasers should assess household priorities against this structured decision matrix:
Butler County maintains significantly lower county and school millage rates and assesses properties at a lower baseline ratio, resulting in annual property tax savings of 30 to 50 percent compared to equivalent homes in Allegheny County.
The Common Level Ratio (CLR) is a state-calculated equalization factor applied to purchase prices during assessment appeals. In Allegheny County, public school districts regularly file reverse appeals against recent buyers to raise assessments, whereas this practice is far less aggressive in Butler County.
Most suburban municipalities in both Allegheny and Butler counties levy a baseline 1.0 percent local earned income tax. However, the City of Pittsburgh imposes a 3.0 percent rate, making suburban relocation financially advantageous for wage earners.
Butler County offers far more active new construction communities due to abundant undeveloped land, favorable municipal zoning, and developer tax incentives across Cranberry, Adams, Mars, and Middlesex.
Northern Allegheny County suburbs like Wexford, McCandless, and Ross average 20 to 30 minutes to Downtown Pittsburgh, while southern Butler County communities like Cranberry and Seven Fields average 35 to 50 minutes during peak morning rush hours.
Deciding between Allegheny County and Butler County is not simply a geographic choice; it is an economic and lifestyle strategy that impacts family finances for decades to come. By balancing monthly property tax escrow savings against commute times and architectural styles, homebuyers can make a confident, well-calibrated investment in Western Pennsylvania real estate.
Comprehensive market analysis, historical sales data, and precise tax assessment projections provide essential clarity when comparing Allegheny and Butler County communities. Analyzing county assessment records, millage updates, and municipal transit access enables homebuyers to make confident, data-driven decisions that align with their long-term housing budget.


